Let learn monitor and log with google cloud observability with challenge lab.
Challenge scenario
In your new role as Junior Cloud Engineer for Jooli Inc., you're expected to help manage the Cloud infrastructure components and support the video operations team. Common tasks include monitoring resource utilization, analyzing logs, configuring alerts, and reporting on any issues related to Jooli Inc.'s online services.
Task 1. Configure Cloud Monitoring
1. Go to Compute Engine > VM Instances
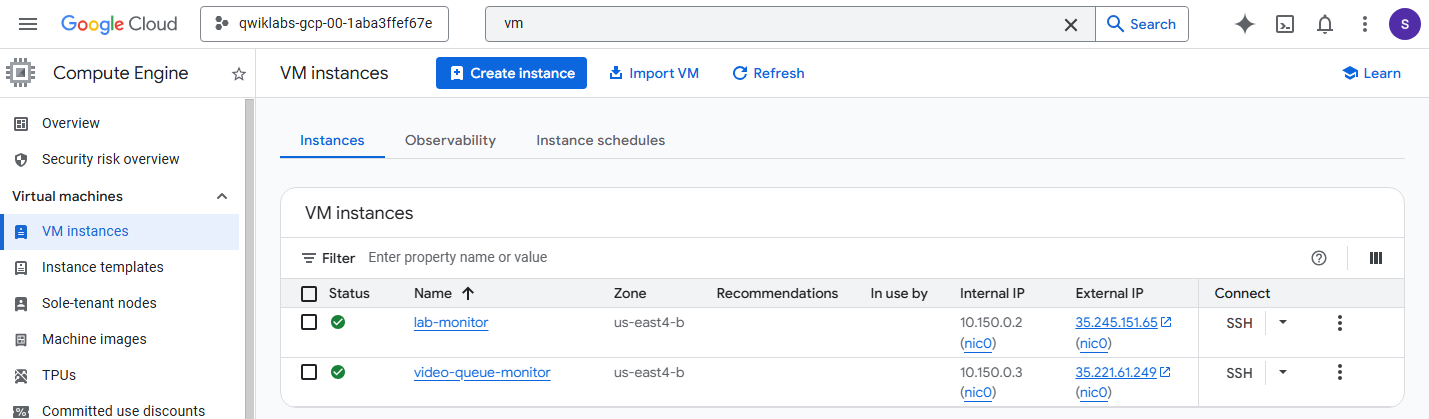
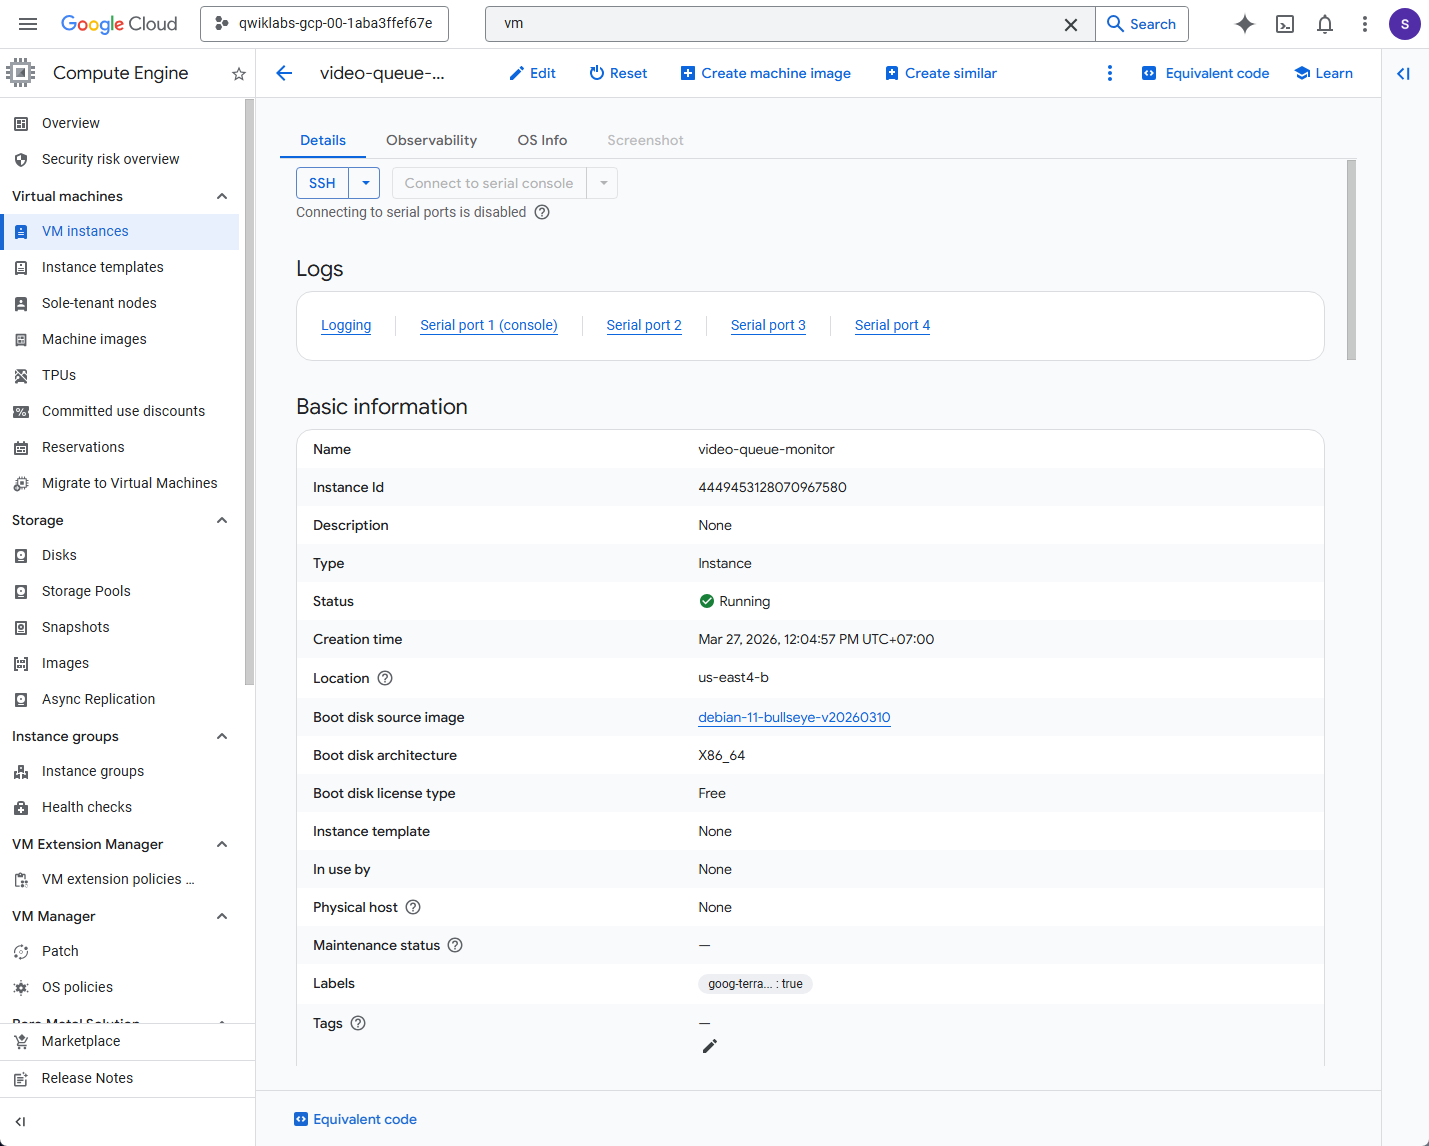
2. Click on the name of VM that lab provisioned: video-queue-monitor.
3. On the VM details, copy Instance ID, Zone, and Project ID (From Qwiklabs Google Cloud Project ID).
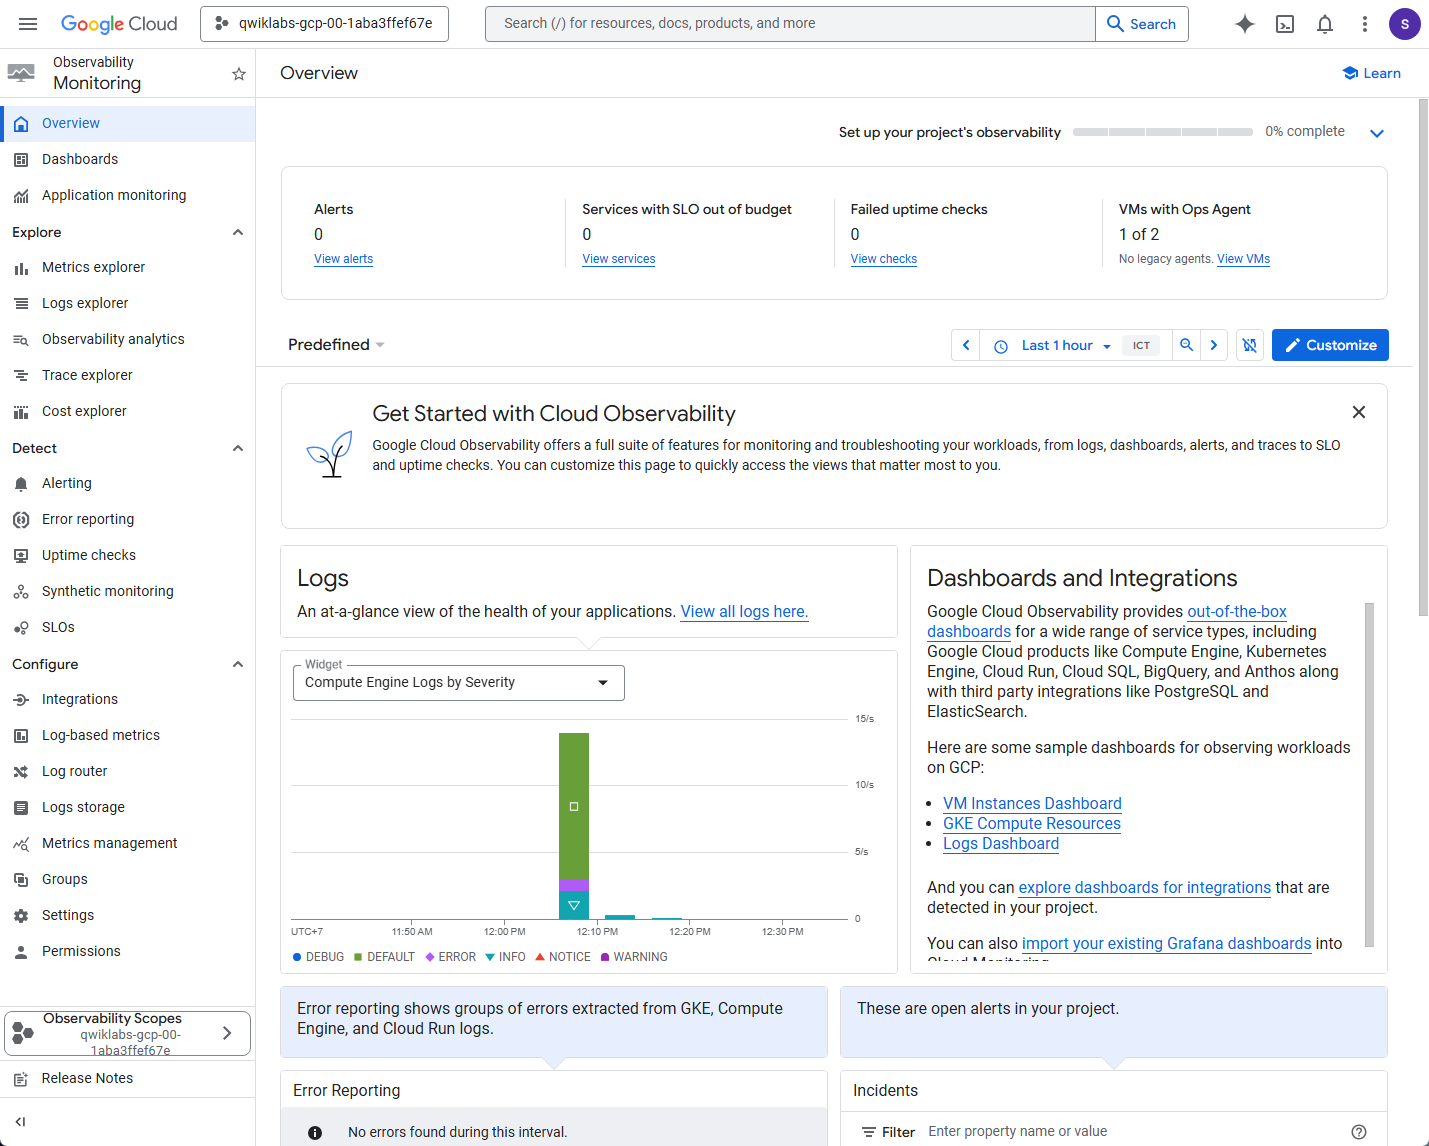
4. In search bar, type Monitoring.
5. Wait a few moments. For visiting this page initializes. This will enable Cloud Monitoring API for the project.
Task 2. Configure a Compute Instance to generate Custom Cloud Monitoring metrics
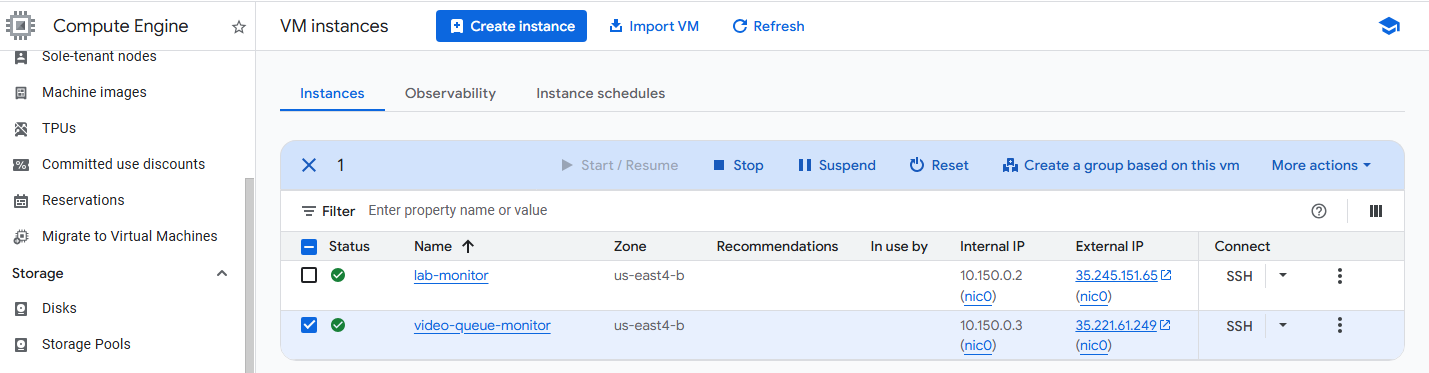
1. Go back to Compute Engine > VM instances.
2. Click on the video-queue-monitor VM.
3. Click the Edit button.
4. Scroll down to the Customer metadata section. Then modify the values inside the script by replace the dummy text.
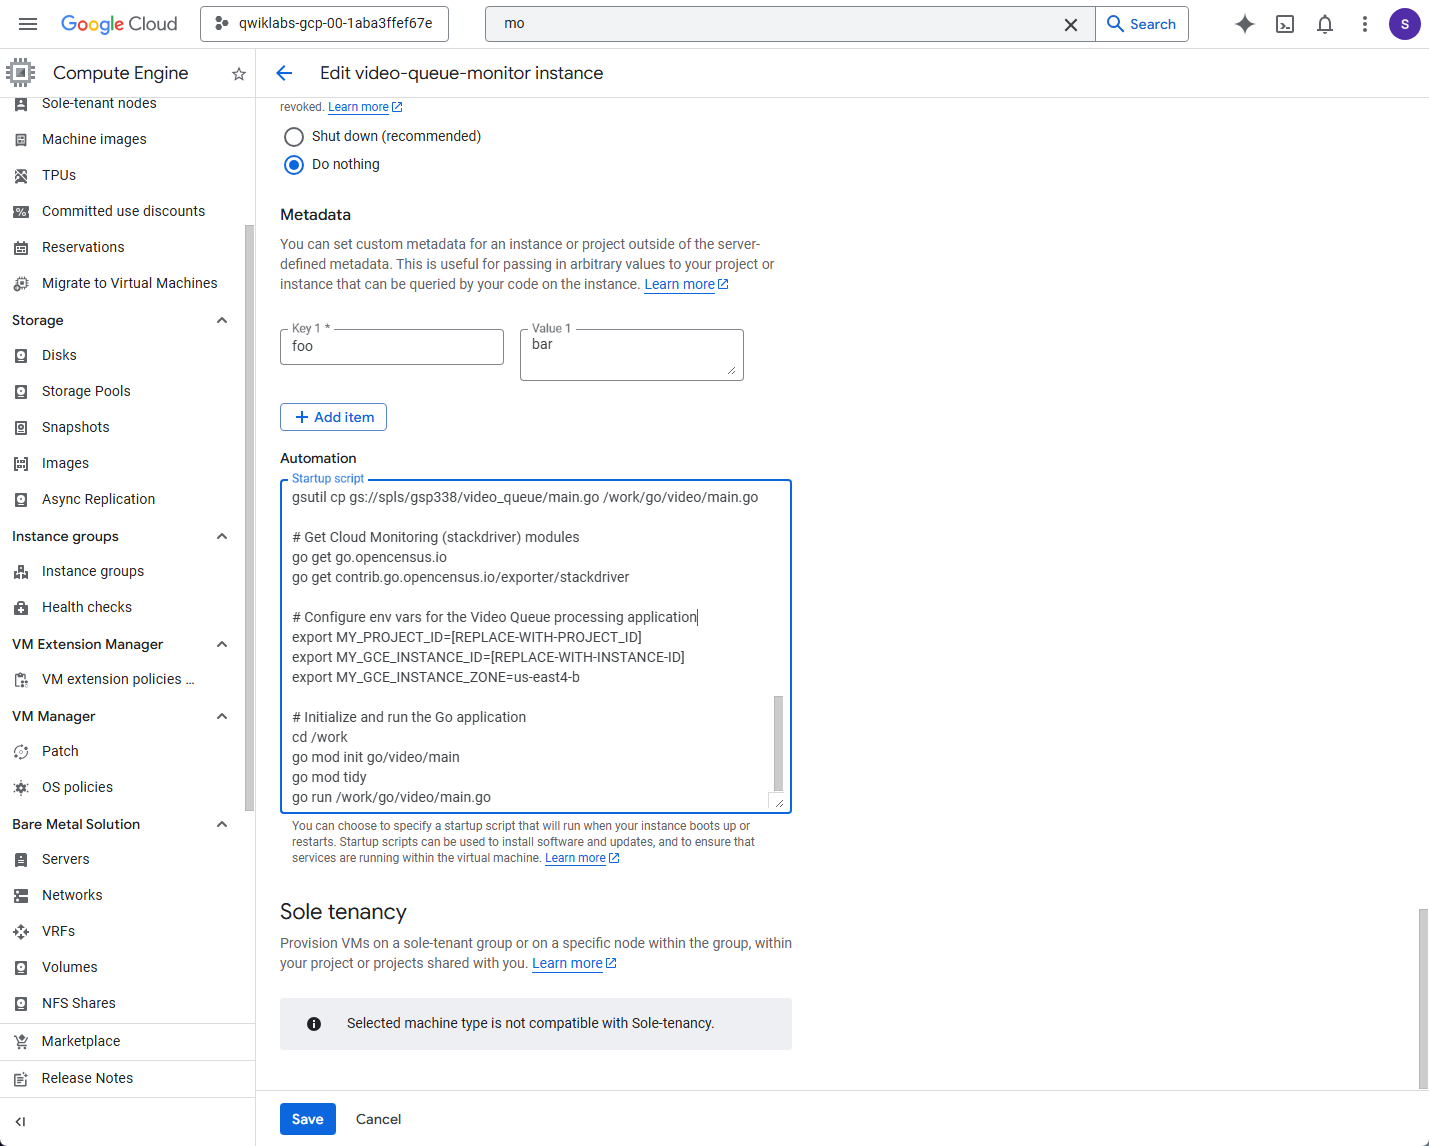
5. Click Save.
6. Go back to VM list page (Main VM instances page).
7. Click Stop and wait a minute for the VM to stop. Then click Start / Resume. This will reboots the VM and runs the modified startup script. That allow custom metrics to start generating.
Task 3. Create a custom metric using Cloud Operations logging events
1. In search bar, type Logs Explorers.
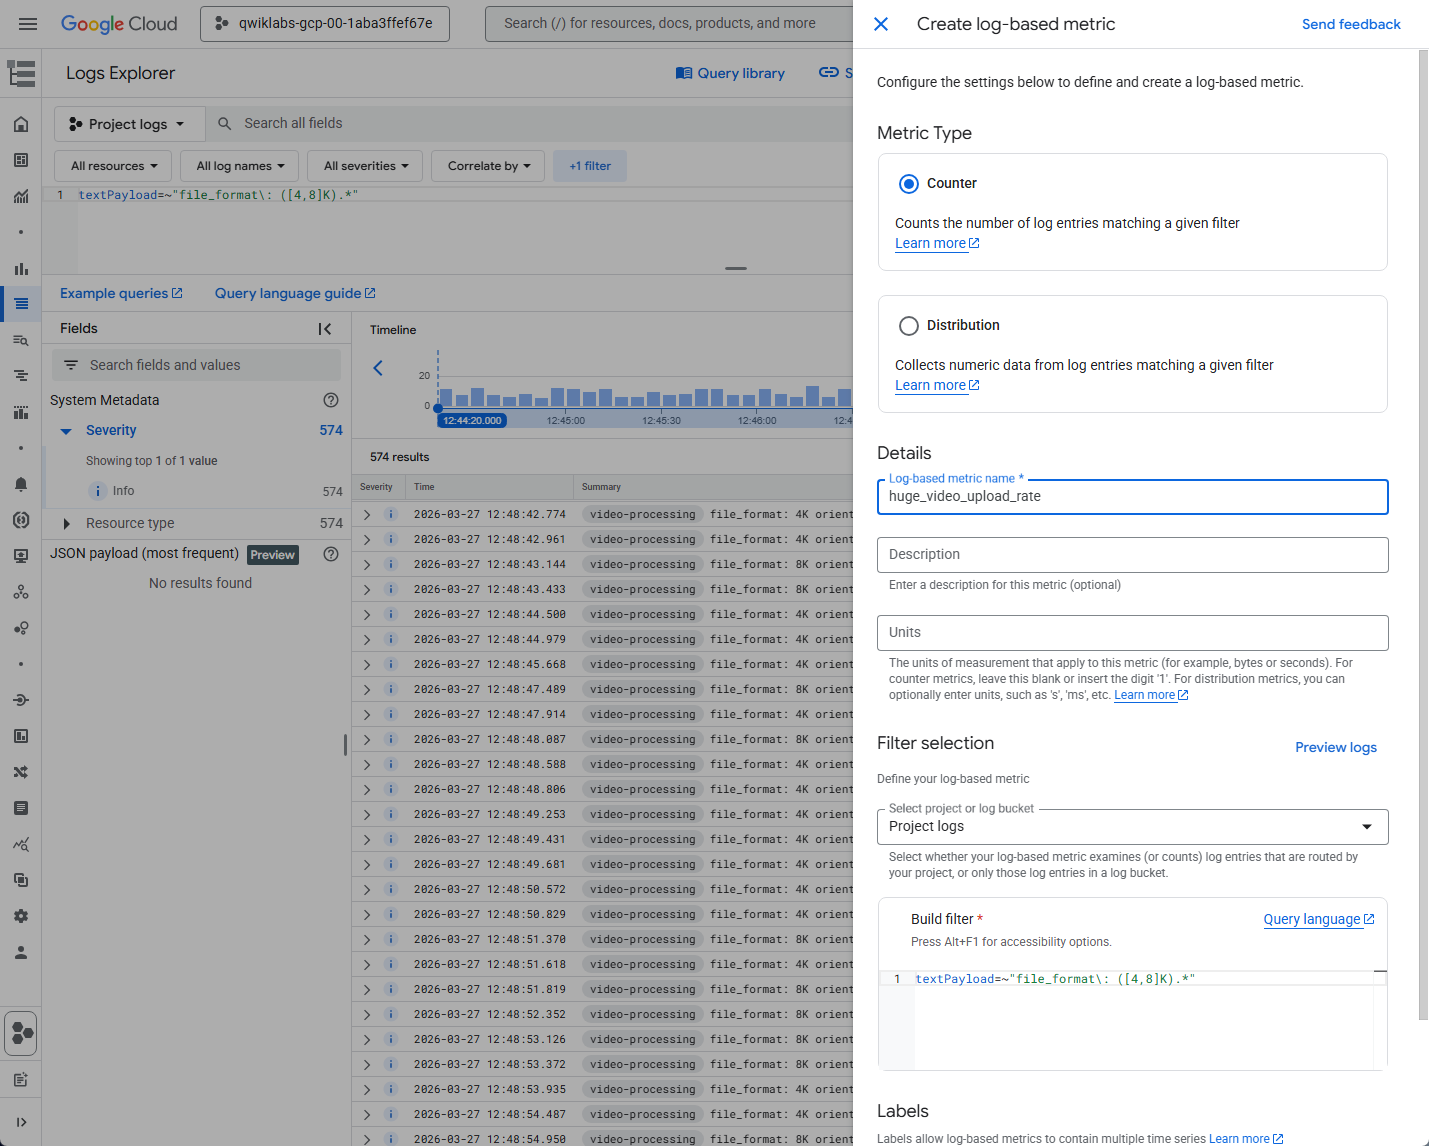
2. Copy and paste this query into the query editor.
textPayload=~"file_format\: ([4,8]K).*"3. Click Run Query. (For viewing the result)
4. Click the Create Metric button on Action button.
5. Configure the metric:
Metric Type: Counter
Log metric name: [follow the lab custom metric name] eg., like
big_video_upload_rate,huge_video_upload_rate
6. Click Create Metric.
Task 4. Add custom metrics to the Media Dashboard in Cloud Operations Monitoring
1. In search bar, Type Dashboards.
2. Click on Create Custom Dashboard.
3. Add the first Chart (Title: Video Queue Size)
Click + Add Widget, then select Line Chart.
In the Metric search box, type
custom.googleapis.com/opencensus/my.videoservice.org/measure/input_queue_sizeIf the metric doesn't appear, uncheck the "Active" toggle or wait around 3-5 minutes for the newly restarted VM to send the first metric.Select and click Apply.
4. Add the second Chart (Title: High Resolution Video Upload Rate)
Click + Add Widget, then select Line Chart.
In the Metric search box, type the metric name from Task 3. that the lab setting eg., like
huge_video_upload_rateIt's under VM Instance > Logs-based metrics. If the metric doesn't appear, uncheck the "Active" toggle or wait around 3-5 minutes for the metric appear.
Task 5. Create a Cloud Operations alert based on the rate of high resolution video file uploads
1. In search bar, type Alerting
2. Click + Create Policy
3. Click Select a metric:
Search for metric name from Task 3. and Task 4. like
huge_video_upload_rate(It's the name that the lab setting.)Navigate to VM Instance > Logs-based metrics > huge_video_upload_rate (Or the lab setting).
Click Apply
4. Configure the Condition:
Condition type: Threshold
Threshold position: Above threshold
Threshold value: (From the lab setting, eg., 3 or other)
Click Next.
5. Configure Notifications
Click the Notification Channels dropdown, select Manage Notification Channels (Open new tab)
Add email under "Email", set personal email and naming like "Email Address" or other name.
Select Email under dropdown from Notification Channels dropdown. Click Next.
6. Give the alert policy a name, like "High resolution video file uploads", and click Create Policy.
Congratulations. Complete the lab.