
Let learn about monitoring in google cloud via challenge lab.
Challenge scenario
As a junior cloud engineer, you are part of a team of people assigned to manage Google Cloud resources in your organization. One of your job requirements in this role is to use the Cloud Logging and Cloud Monitoring services to monitor Apache Web Server activities installed on a virtual machine (VM) instance.
Let start the lab.
Task 1. Install the Cloud Logging and Monitoring agents
Go to Compute Engine > VM Instances.
Click SSH button on the provisioned VM.
Install the logging agent.
curl -sSO https://dl.google.com/cloudagents/add-logging-agent-repo.sh
sudo bash add-logging-agent-repo.sh --also-install
Install the monitoring agent.
curl -sSO https://dl.google.com/cloudagents/add-monitoring-agent-repo.sh
sudo bash add-monitoring-agent-repo.sh --also-install
Enable the Apache Web Server monitoring plugin.
cd /etc/stackdriver/collectd.d/sudo curl -O https://raw.githubusercontent.com/Stackdriver/stackdriver-agent-service-configs/master/etc/collectd.d/apache.confsudo service stackdriver-agent restart
Task 2. Add an uptime check for Apache Web Server on the VM
Go to search bar, "Uptime checks" Under Monitoring
Click + Create Uptime Check button
Config with these settings:
Protocol: HTTP
Resource Type: URL
Hostname: (External IP of VM from Task 1.)
Path: /
Click continue.
Click Test for validation, Once it returns a "200 OK", click Create.
Task 3. Add an alert policy for Apache Web Server
Generate Test Traffic by switch to VM's SSH terminal window. and run this command. It will generate network traffic for alert policy can trigger.
timeout 120 bash -c -- 'while true; do curl localhost | grep -oP ".*"; sleep .1s;done'Go back to Cloud Console, go to search bar, "Alerting" under Monitoring
Click + Create Policy button
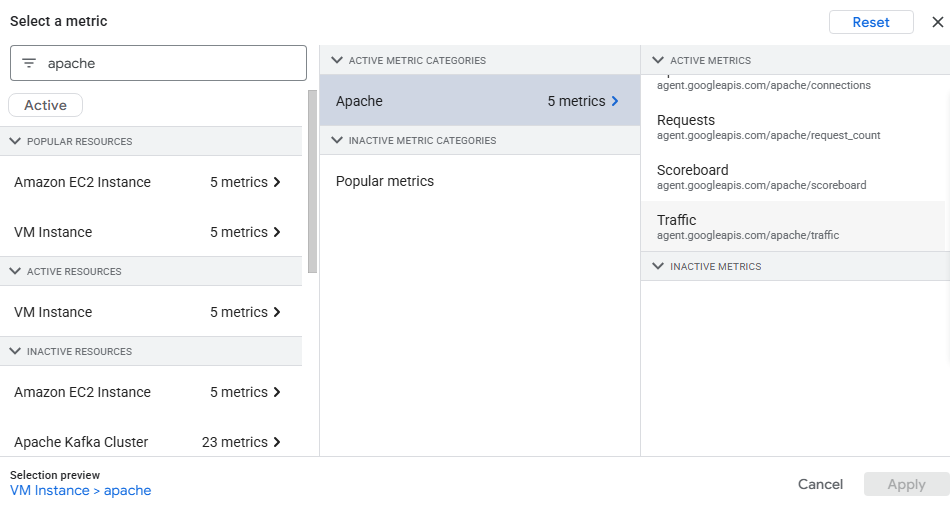
Select metric dropdown:
Uncheck the "Active" toggle.
Type "traffic" in search bar
Nagivate to VM Instance > Apache > Network traffic
Click Apply
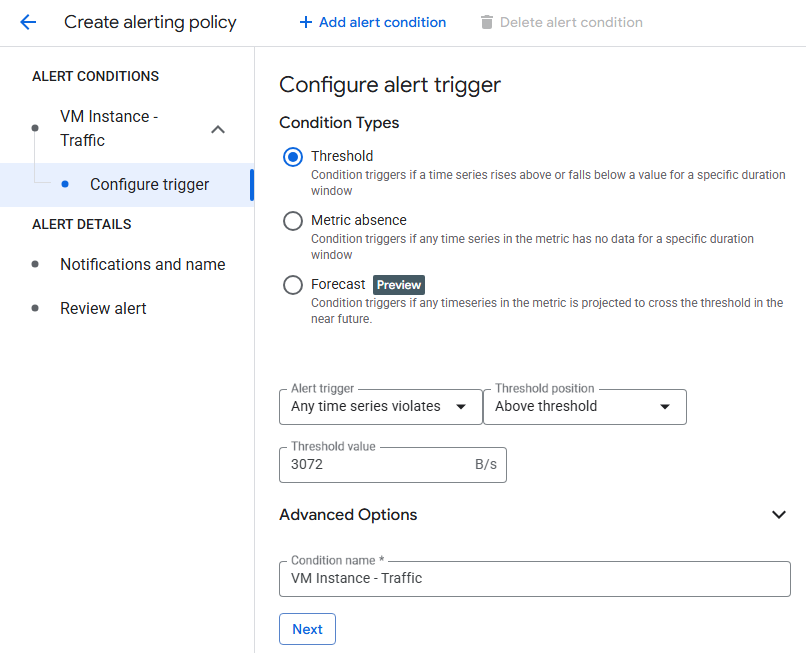
Configure the Condition
Condition Type: Threshold
Threshold position: Above threshold
Threshold value: 3072 (3 KiB/s in bytes)
Click Next.
Configure Notifications:
Click on drop-down for Notification Channels and select Manage Notification Channels
Scroll down to Email and click Add New
Enter personal email or alternative email for receive alert email, give a display name like "Email Address" or related, and click Save.
Go back to Alerting tab, select a newly added email, and click OK.
Name the alert policy like "Apache Traffic Alert" or anything, and click Create Policy.
Task 4. Create a dashboard and charts for Apache Web Server on the VM
Go to search bar, "Dashboard" under Monitoring.
Click + Create Dashboard.
Add first chart (Title: CPU Load):
Click + Add Widget and select Line Chart.
In the Metric search box, type CPU load (1m).
Select the metric under VM Instance > CPU and click Apply.
Add second chart (Title: Apache Requests):
Click + Add Widget and select Line Chart.
Uncheck "Active" toggle, In Metric search box, type Requests.
Select the metric under VM Instance > Apache > Requests and click Apply
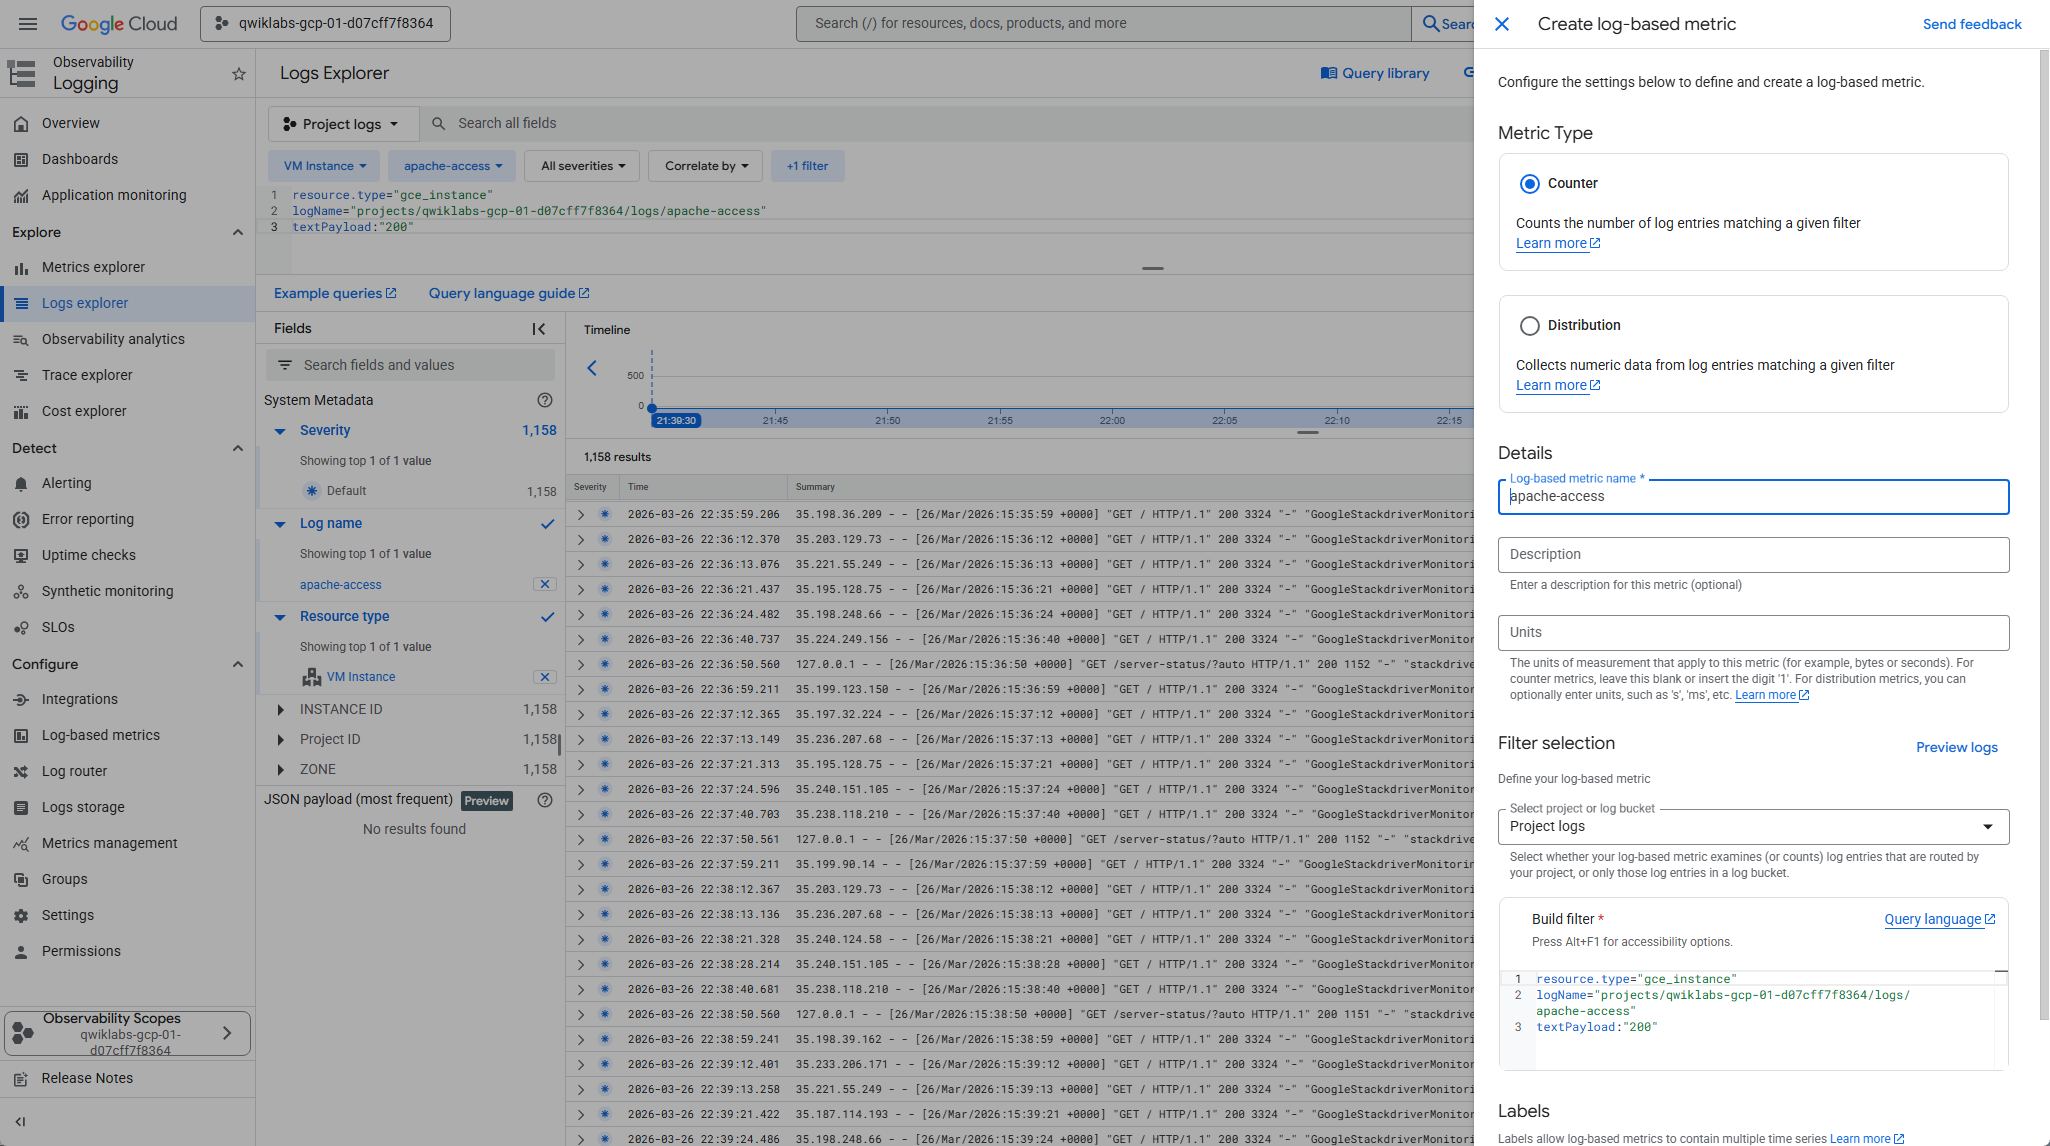
Task 5. Create a log-based metric
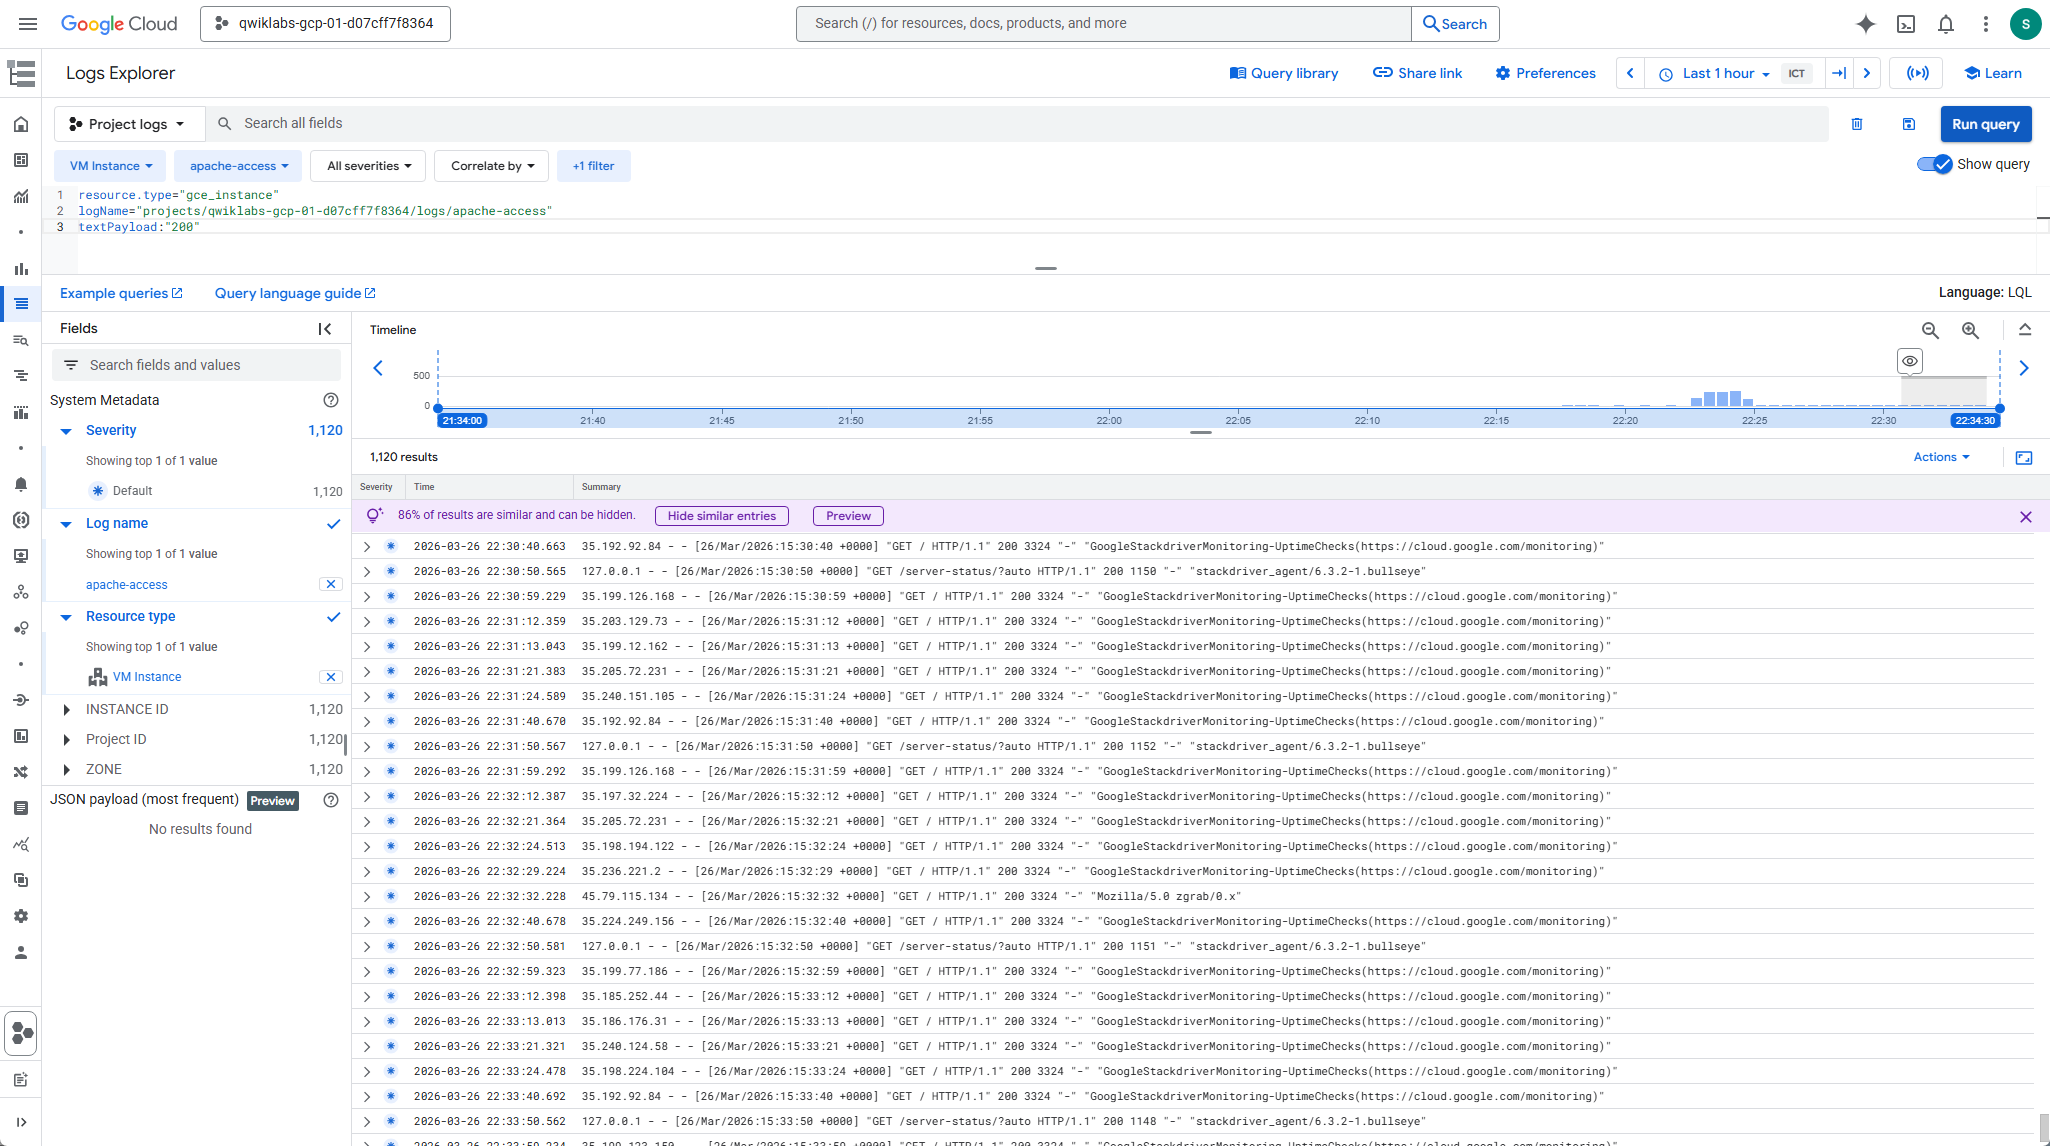
In search bar, "Logs Explorer".
Select filters:
Resource Type: VM Instance
Log Metric: apache-access
Add textPayload:"200" on query editor
Click Actions button on right area.
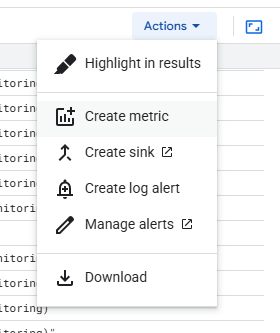
Click Create metric
Metric Type: Counter
Log metric name: apache-access
Congratulations. Complete the lab.